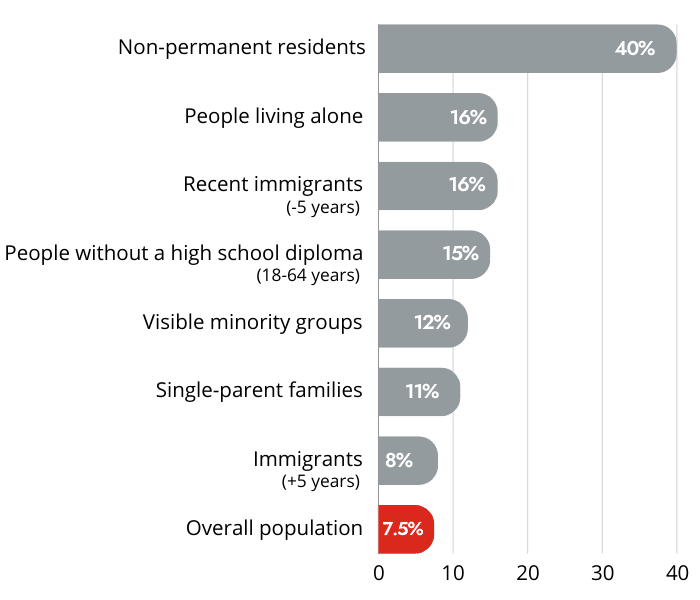
2, 3 and even 5 times poorer
And the challenges that call for action
Not everyone has the same risk of poverty.
Belonging to specific groups, such as a visible minority, as well as individual life circumstances, such as immigrating, being a single parent, living alone or not having a high school diploma, are all factors that increase the risk of poverty. These risks, which can be two, three, and even five times the average, create obstacles and challenges that are often difficult to overcome without support.
These at-risk groups are over-represented in Greater Montreal, particularly on the Island of Montreal. A better understanding of their realities lets us come up with solutions—in collaboration with the network of community agencies we support—that are better suited to their needs.
Poverty rate by population group

The MBM is a minimum threshold
Based on the Market Basket Measure (MBM), Canada’s official measure of poverty. The MBM is based on the cost of a specific basket of goods and services that cover basic needs: housing, food, clothing, transportation and other necessities. It is calculated based on region and number of people in the household.
The MBM is a minimum threshold: being slightly above it does not mean you are out of poverty. People close to this threshold are also in a vulnerable situation.
The information in this section is from the 2021 Canadian census, CMHC housing data, and provincial immigration statistics.
Immigrants
and non-permanent
residents
Poverty rate of non-permanent residents
5X higher than that of the overall population (7.5%).
Poverty rate of recent immigrants
2.5X higher than that of non-immigrants (6%).

Key facts
Non-permanent residents (temporary workers, international students and asylum seekers) represent the group most at risk of poverty.
Quebec’s non-permanent residents have more than doubled over the past four years and reached over 500,000 in 2024.
79% of Quebec’s non-permanent residents live in Greater Montreal.
The Montreal neighbourhoods with the most non-permanent residents are Le Plateau-Mont-Royal (15,915 people), Côte-des-Neiges (13,955 people) and Peter-McGill (11,360 people). 20% of Quebec’s non-permanent residents live in these areas.
However, the poverty rate among immigrants decreases the longer they stay, as the more time they spend here, the better their economic situation becomes.


Poverty rate by immigration status

People
from visible
minority groups
Poverty rate
2X higher than for people who do not belong to a visible minority group (6%).

Key facts
More than a quarter (27%) of Greater Montreal’s population is from a visible minority group. This rate rises to 38% on the Island of Montreal.
Whether immigrants or not, people from visible minority groups are at a greater risk of poverty.
Being both an immigrant and a member of a visible minority group also increases the risk of poverty.
Among people born in Canada, the poverty gap has been narrowing between visible minorities and non-visible minorities.


Poverty rate by immigration status and visible minority status*

* The visible minority population consists mainly of the following groups: South Asian, Chinese, Black, Filipino, Arab, Latin American, Southeast Asian, West Asian, Korean and Japanese.
People
living alone
Poverty rate
5X higher than that of couples and two-parent families (3%).

Key facts
In Quebec, 35% of households consist of a single person, which is the highest rate of all Canadian provinces.
In some of Montreal’s central neighbourhoods, over 50% of households consist of just one person. The Faubourg Saint-Laurent* has the highest percentage of these households (61%).
84% of households receiving social assistance consist of a single person.
36% of single people spend too much of their income on housing (30% or more of their income), which is far more than for couples (11%) and two-parent families (7%).
65% of people living alone are renters.
* Downtown area that includes the Quartier latin, Chinatown, and the Quartier des spectacles.


Poverty rate and housing expenditure-to-income ratio*

*The expenditure-to-income ratio indicates the share of a household’s income spent on housing costs.
If this ratio goes beyond 30%, it’s challenging for the household to afford other essentials like food, clothing, or transportation.
Single parent
families
Poverty rate
3.5X higher than that of two-parent families (3%).

Key facts
Over half (55%) of families in a situation of poverty are single-parent families, i.e. 19,965 families, compared with 15,320 two-parent families.
78% of single-parent families are headed by women.
In Greater Montreal, Le Vieux-Longueuil has the highest number of single-parent families (7,020 families).
In Montreal, six neighbourhoods have rates of single parents of 40% or higher: Sainte-Geneviève, Saint-Henri, Petite-Bourgogne, Pointe-Saint-Charles, Centre-Sud and Montréal-Nord.


Poverty rate of families

Number of families in a situation of poverty

People
without diploma
Poverty rate
almost 2X higher than for people with a high school or CEGEP diploma (8%).

Key facts
A high school or CEGEP diploma is a powerful protective factor against poverty, as it halves the risk of living below the low-income cut-off.
In Greater Montreal, 10% of adults aged 25 to 64 do not have a high school diploma.
Not only are people with a low education level at greater risk of poverty, they struggle to reach average or high income levels even when they do work.
On average, employed adults aged 25 to 64 without a diploma earn 62% of the average annual income, or $33,600 compared to $54,350.
People with a university degree earn over twice as much as those without degrees, with an average income of $74,800 versus $33,600.
In Centraide of Greater Montreal’s territory, low education rates are particularly high in rural areas. The municipality of Noyan in the Haut-Richelieu RCM has the highest rate of adults without a diploma (29%).
In Montreal, the neighbourhoods with the highest rates are Parc-Extension (27%), Saint-Michel (24%) and Montréal-Nord (22%).
65% of people aged 18 to 64 with a low education level are renters.
Even for people not experiencing poverty, having a low education level or no diploma has a significant impact on income and the ability to accumulate wealth.


Poverty rate by education level (ages 18 to 64)

Average income in Quebec by education level (ages 25 to 64)*

*2020 Data

A look at other vulnerable groups
To broaden our perspective, the following information reveals the realities and needs of other groups, such as people with disabilities, 2SLGBTQIA+ people, Indigenous people, and people experiencing homelessness.
In Canada, the risk of food insecurity for people with limitations is more than two times higher than for people without disabilities. They also have a four times higher risk of severe food insecurity.
In Quebec, 2SLGBTQIA+ people, especially youth people, face an increased risk of homelessness.
16% of people experiencing homelessness report belonging to a sexual or gender minority. Among youth, this proportion rises to 29%.
In Greater Montreal (excluding Kahnawà:ke), 10% of Indigenous people live in poverty, a rate that is higher than that of the general population (7.5%). Among Indigenous people (First Nations, Inuit, and Métis), the Inuit have the highest poverty rate (17%).
In Montreal, 13% of people experiencing homelessness identify as Indigenous, whereas they represent only 1% of the population.
80% of Inuit in Quebec who are experiencing homelessness live in Montreal.
About one third (31%) of people in a situation of homelessness do not have a high school diploma.
Indigenous people, men, 2SLGBTQIA+ youth, young people who have been placed in care by the Director of Youth Protection, and people who have served in the Canadian Armed Forces or the Royal Canadian Mounted Police are over-represented among those experiencing homelessness.
On the Island of Montreal, the population experiencing visible homelessness is older than in the rest of Quebec and proportionately includes more immigrants and asylum seekers. What’s more, these people can face longer periods of homelessness that often exceed one year.


